
Page 221 - SC SCAR 2023 ENGLISH Flipbook
P. 221
INVESTMENT MANAGEMENT
FUND MANAGEMENT
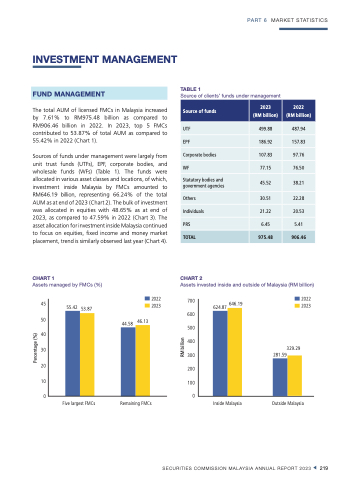
The total AUM of licensed FMCs in Malaysia increased by 7.61% to RM975.48 billion as compared to RM906.46 billion in 2022. In 2023, top 5 FMCs contributed to 53.87% of total AUM as compared to 55.42% in 2022 (Chart 1).
Sources of funds under management were largely from unit trust funds (UTFs), EPF, corporate bodies, and wholesale funds (WFs) (Table 1). The funds were allocated in various asset classes and locations, of which, investment inside Malaysia by FMCs amounted to RM646.19 billion, representing 66.24% of the total AUM as at end of 2023 (Chart 2). The bulk of investment was allocated in equities with 48.65% as at end of 2023, as compared to 47.59% in 2022 (Chart 3). The asset allocation for investment inside Malaysia continued to focus on equities, fixed income and money market placement, trend is similarly observed last year (Chart 4).
CHART 1
Assets managed by FMCs (%)
45
50
40 30 20 10
TABLE 1
Source of clients’ funds under management
PART 6 MARKET STATISTICS
Source of funds
2023 (RM billion)
2022 (RM billion)
UTF
499.88
487.94
EPF
186.92
157.83
Corporate bodies
107.83
97.76
WF
77.15
76.50
Statutory bodies and government agencies
45.52
38.21
Others
30.51
22.28
Individuals
21.22
20.53
PRS
6.45
5.41
TOTAL
975.48
906.46
CHART 2
Assets invested inside and outside of Malaysia (RM billion)
55.42 53.87
2022 700 2023
600
500
400
300
200
100
624.87
646.19
2022 2023
00 Five largest FMCs Remaining FMCs
Inside Malaysia
Outside Malaysia
44.58 46.13
281.59
329.29
SECURITIES COMMISSION MALAYSIA ANNUAL REPORT 2023 219
Percentage (%)
RM billion
