
Page 22 - CMP3
P. 22
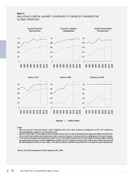
 Chart 5
MALAYSIA’S CAPITAL MARKET1 CONTINUED TO DEVELOP TOWARDS THE GLOBAL FRONTIER2
            1.0 0.8 0.6 0.4 0.2
1.0 0.8 0.6 0.4 0.2
1.0 0.8 0.6 0.4 0.2
Overall Financial Development
Financial Institution Development
Capital Market (CM) Development
1.0
0.8
0.6
0.4
0.2 000
                 Depth of CM3
Access of CM3
Efficiency of CM3
            1.0 0.8 0.6 0.4 0.2
1.0 0.8 0.6 0.4 0.2
              000
Malaysia Global frontier
     Notes:
1 IMF uses the term ‘Financial Market’, which comprises bond and equity markets, to designate the CM. For consistency,
Financial Market is referred to as CM in this chart.
2 Global frontier refers to the highest ranked country for each year for any given financial development index and sub-index.
All six charts plot the financial development index and sub-indices for the global frontier and Malaysia in five-year intervals.
3 The indices summarise how developed a CM is in terms of (a) depth (measures of size and liquidity of markets relative to GDP), (b) access (percentage of market capitalisation outside of top 10 largest companies and total number of debt issuers) and (c) efficiency (stock market turnover ratio) – all of which contribute towards the overall level of a country’s financial development.
Source: Financial Development Index Database, IMF, 2019.
20 SECURITIES COMMISSION MALAYSIA
   1980
1985
1990
1995
2000
2005
2010
2015
2018
1980
1985
1990
1995
2000
2005
2010
2015
2018
1980
1985
1990
1995
2000
2005
2010
2015
2018
1980
1985
1990
1995
2000
2005
2010
2015
2018
1980
1985
1990
1995
2000
2005
2010
2015
2018
1980
1985
1990
1995
2000
2005
2010
2015
2018
