
Page 25 - CMP3
P. 25
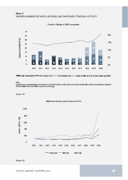
                                 Chart 7
HIGHER NUMBER OF MIDS LISTINGS AND IMPROVED TRADING ACTIVITY
Growth in listings of MidS companies
    40
    35
    30
    25
    20
    15
    10
5 0
Main Market (LHS)
20%
15%
10%
7
29 10
2121 2017 2018 2019 2020
  15
 11
  11
 11
 5
 6
 6
1
10 5
5% 0%
     3
 6
  5
 3
 4
 3
  3
 3
    2010
2013 2014 2015 2016
LEAP Market (LHS)
2011
ACE Market (LHS)
2012
Share of MidS as a % of total market cap (RHS)
    Note:
MidS stocks comprise listed companies on the LEAP Market, ACE market and Main market (with market capitalisation between RM200 million and RM2 billion as at time of listing).
Source: SC.
1,000
         800
         600
         400
         200
0
Source: SC.
MidS turnover has grown since end 2010
 2010 2011
2012 2013
Large Cap
2014 2015
Mid Cap
2016 2017 2018 Small Cap
2019 2020
     CAPITAL MARKET MASTERPLAN 3
 23
 Index: 2010 = 100
Number of MidS IPOs
