
Page 26 - SC SCAR 2023 ENGLISH Flipbook
P. 26
PART 1 CAPITAL MARKET REVIEW AND OUTLOOK
CHART 5
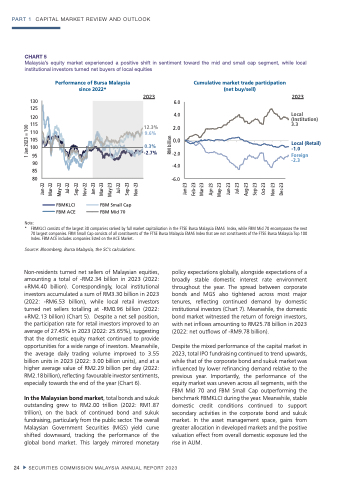
Malaysia’s equity market experienced a positive shift in sentiment toward the mid and small cap segment, while local institutional investors turned net buyers of local equities
130
2023
11330 125
66..0
44..0
2..0
Performance of Bursa Malaysia since
Cumulative market trade participation (net buy/sell)
Performance of Bursa Malaysia
2022*
20232023 2023
since 2022*
2023
11225 120
Local (Institution) 3.3
Local (Retail) -1.0
-2.0 Foreign
11220 115
12.3%
1115 110
12.3%
1015110 100
9.96.%6% 0.03.%3%
11005 95
0.0
11000 90
0.0
8595 8090 85 80
-2.7%
-2.0
24
SECURITIES COMMISSION MALAYSIA ANNUAL REPORT 2023
FBM KLCI FBM ACE
FBM Small Cap FBM Mid 70
FBMKLCI
FBM Small Cap
FBM KLCI
FBM Small Cap
-2.7%
-2.3
-4-4.0.0 --66..0
FBM ACE
FBM Mid 70
FBMACE FBMMid70
Note:
* FBMKLCI consists of the largest 30 companies ranked by full market capitalisation in the FTSE Bursa Malaysia EMAS Index, while FBM Mid 70 encompasses the next
policy expectations globally, alongside expectations of a broadly stable domestic interest rate environment throughout the year. The spread between corporate bonds and MGS also tightened across most major tenures, reflecting continued demand by domestic institutional investors (Chart 7). Meanwhile, the domestic bond market witnessed the return of foreign investors, with net inflows amounting to RM25.78 billion in 2023 (2022: net outflows of -RM9.78 billion).
Despite the mixed performance of the capital market in 2023, total IPO fundraising continued to trend upwards, while that of the corporate bond and sukuk market was influenced by lower refinancing demand relative to the previous year. Importantly, the performance of the equity market was uneven across all segments, with the
#
70 largest companies. FBM Small Cap consists of all constituents of the FTSE Bursa Malaysia EMAS Index that are not constituents of the FTSE Bursa Malaysia Top 100
Data Ransomware
Index. FBM ACE includes companies listed on the ACE Market. Insider
Source: Bloomberg, Bursa Malaysia, the SC’s calculations.
Non-residents turned net sellers of Malaysian equities, amounting a total of -RM2.34 billion in 2023 (2022: +RM4.40 billion). Correspondingly, local institutional investors accumulated a sum of RM3.30 billion in 2023 (2022: -RM6.53 billion), while local retail investors turned net sellers totalling at -RM0.96 billion (2022: +RM2.13 billion) (Chart 5). Despite a net sell position, the participation rate for retail investors improved to an average of 27.45% in 2023 (2022: 25.65%), suggesting that the domestic equity market continued to provide opportunities for a wide range of investors. Meanwhile, the average daily trading volume improved to 3.55 billion units in 2023 (2022: 3.00 billion units), and at a higher average value of RM2.29 billion per day (2022: RM2.18 billion), reflecting favourable investor sentiments, especially towards the end of the year (Chart 6).
In the Malaysian bond market, total bonds and sukuk outstanding grew to RM2.00 trillion (2022: RM1.87 trillion), on the back of continued bond and sukuk fundraising, particularly from the public sector. The overall Malaysian Government Securities (MGS) yield curve shifted downward, tracking the performance of the global bond market. This largely mirrored monetary
Leakage Threat
FBM Mid 70 and FBM Small Cap outperforming the benchmark FBMKLCI during the year. Meanwhile, stable domestic credit conditions continued to support secondary activities in the corporate bond and sukuk market. In the asset management space, gains from greater allocation in developed markets and the positive valuation effect from overall domestic exposure led the rise in AUM.
Secret (Rahsia)
JaJna-n2-22 Mar-22
MaMra-r2-22 May-22
MaMya-y2-22 Jul-22 JuJlu-l2-22
SeSpe-p2-22 Nov-22
NoNvo-v2-22Jan-23 JaJna-n2-23
MaMra-r2-23 May-23
MaMya-y2-23 Jul-23 JuJlu-l2-232
SeSpe-p2-233 Nov-23
NoNvo-v2-23
JaJan-23 FFeb-23 Maarr-23 Aprr-23
Maay-23 JJun-23 JJull-23 AAuug-23 SSeep-23 Octt-23 NNoov-23 DDeecc-23
Jan-22
Sep-22
Mar-23
Sep-23
1 Jan 2023=100
1 Jan 2023=100
1 Jan 2023 = 100
RM billion
RM billion
