
Page 27 - SC SCAR 2023 ENGLISH Flipbook
P. 27
8
7
6 5 4 3 2 1 0
Daily volume traded
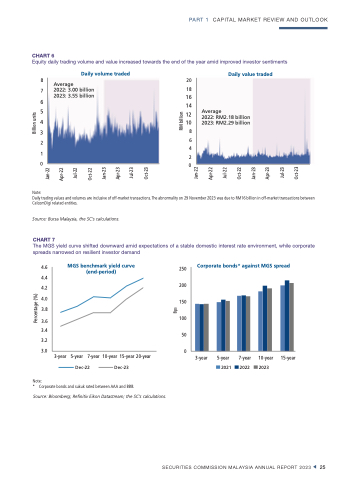
Average 20 2022: 3.00 billion 18
Daily value traded
Average
2022: RM2.18 billion 2023: RM2.29 billion
PART 1 CAPITAL MARKET REVIEW AND OUTLOOK
CHART 6
Equity daily trading volume and value increased towards the end of the year amid improved investor sentiments
2023: 3.55 billion
16 14 12 10
8 6 4 2 0
Note:
Daily trading values and volumes are inclusive of off-market transactions. The abnormality on 29 November 2023 was due to RM16 billion in off-market transactions between CelcomDigi related entities.
Source: Bursa Malaysia, the SC’s calculations.
CHART 7
The MGS yield curve shifted downward amid expectations of a stable domestic interest rate environment, while corporate spreads narrowed on resilient investor demand
4.6 4.4 4.2
4.0
3.8
3.6
3.4 3.2 3.0
MGS benchmark yield curve (end-period)
250
200
150
100
50 0
Corporate bonds* against MGS spread
3-year 5-year 7-year 10-year 15-year 20-year
Dec-22 Dec-23
3-year
5-year 7-year
10-year 15-year
2021 2022 2023
Note:
* Corporate bonds and sukuk rated between AAA and BBB.
Source: Bloomberg; Refinitiv Eikon Datastream; the SC’s calculations.
SECURITIES COMMISSION MALAYSIA ANNUAL REPORT 2023 25
Percentage (%)
Billion units
Bps
Jan-22 Apr-22 Jul-22 Oct-22 Jan-23 Apr-23 Jul-23
Oct-23
Jan-22 Apr-22 Jul-22 Oct-22 Jan-23 Apr-23 Jul-23 Oct-23
RM billion
